Co-Authored by Dr. Guiseppe Getto and Dr. Suzan Flanagan As a college professor who does research into UX and content strategy, I’m very interested in the conditions local UX folks work in. That’s why, starting in 2017, I’ve partnered with TriUXPA to conduct a UX salary survey. Our survey has done more than just track salaries, however. It’s also tracked what UX professionals in the Triangle Area do for a living, including what skill sets they use. It’s also tracked basic demographic information including age, gender, ethnicity, and education level. Finally, it’s tracked what industry local UXers work in (i.e., finance, education, computers, etc.) and where in the Triangle Area they work (i.e., Raleigh, Durham, Cary, etc.).
In addition, we’ve started doing some analysis to compare trends, such as whether work experience correlates to a higher salary. You’ll see that analysis represented below in the “trends” sections.
If you attended the TriUXPA UX Y’all Conference in 2021, you might have already heard me present on some of these findings with my co-researcher, Dr. Suzan Flanagan.
If not, or if you’re just curious to learn more, I present below the findings of the TriUXPA Salary Survey for 2021!
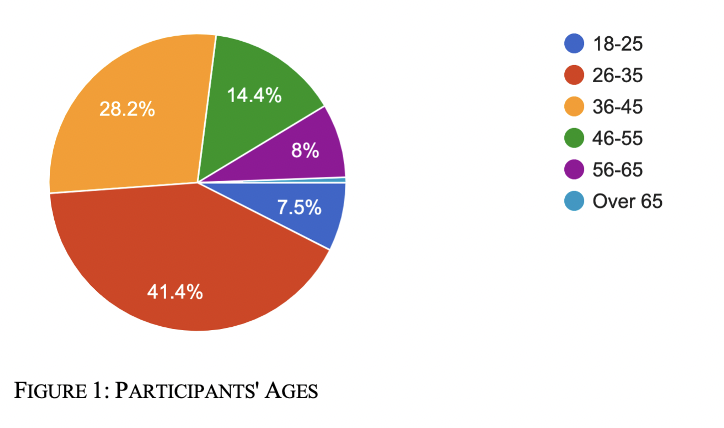
Age
The majority of the UX professionals in this study were between 26 and 45 years old, with 41.4% of them between 26 and 35 and 28.2% of them between 36 and 45. Only one person reported being in the over-65 age range. Figure 1 shows the breakdown of the participants’ ages.
Gender
Nearly two thirds of the survey respondents (there were 174 responses) self-identified as female (64.9%). Slightly more than one third of the respondents self-identified as male (33.9%) and 1.2% self-identified as nonbinary.
Ethnicity
Survey respondents were overwhelmingly White (79.3%). In comparison, in the 2017 survey, 90.4% identified as White. Other ethnicities represented in the survey include the following: Asian (13.8%); Black or African American (3.4%); Hispanic or Latino (2.3%); multiracial (1.2%); and Native Hawaiian or other Pacific Islander (0.6%). One person did not report their ethnicity.
Education
Nearly half the UX professionals (48.9%) reported that the highest degree they held is a bachelor’s degree. More than a third of them (37.9%) hold a master’s degree and 7.5% hold a PhD. None reported having only a high school diploma or GED. Four reported they had completed some college, while two said they have associates degrees, two have graduate certificates, one has a professional degree, and one has a technical or vocational degree.
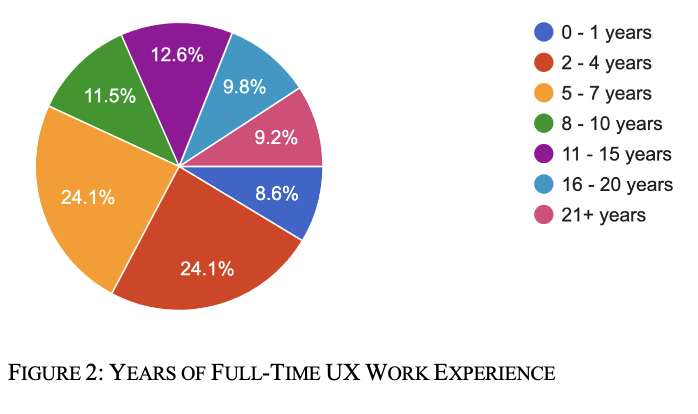
Full-Time UX Work Experience
The largest group of survey respondents has been working 2–7 years in UX and most have been working full time during those years. (See Figure 2 for a detailed breakdown of respondents’ work experience.)
Industry
More than three quarters of these survey respondents work in five industries: software (37.4%), healthcare or medical (12.6%), banking or finance (12.6%), IT consulting (8.6%), and education (5.2%). The remaining respondents work in the following industries: insurance (4.6%); computers or hardware (4.6%); retail or e-commerce (2.9%); advertising, marketing, or public relations (2.3%); non-IT consulting (1.7%); government (1.7%); publishing or media (1.1%); and eight other industries (less than 1% per industry).
Work Location
The survey asked UX professionals where, within the technology hub, they work. The majority reported working in Raleigh (43.1%). Durham (25.3%) was a distant second. Cary and Morrisville were tied for third place with 9.2% each. The remaining survey respondents work in other cities (8.6%) or Chapel Hill (4.6%).
Base Salary
When the survey was conducted in 2017, the combined average base salary was $144,754, and the median salary was $90,000. In 2021, the combined average salary for full-time and part-time UX professionals was $111,347 and the median salary was $109,000. The 2021 base salary figures for full-time and part-time workers are shown below.
Full-time (36+ hours) workers, (148 responses)
-
Average: $117,940
-
Median: $110,500
-
Lowest: $50,000
-
Highest: $195,000
Part-time (< 36 hours) workers, (23 responses)
-
Average: $88,226
-
Median: $90,000
-
Lowest salary: $33,900
-
Highest salary: $174,000
For both full-time and part-time workers in this study, the base salary ranges are similar. The difference between the highest and lowest full-time salary was $145,000 compared to $140,000 for part-time UX professionals.
Job Title
The survey participants reported 95 different job titles; of those, 70 were held by one participant only. The most common job titles were UX Designer (22), Senior UX Designer (17), Senior Product Designer (9), UX Researcher (6), and Product Designer (n = 5).
Within the software industry, 29.7% of the participants had variations of UX Designer job titles (19) and 10.9% held the job title Senior Product Designer (7). The job title Senior UX Designer appears most often in the banking and finance industry (5; 23.8%) and in the healthcare and medical industry (4; 18.2%).
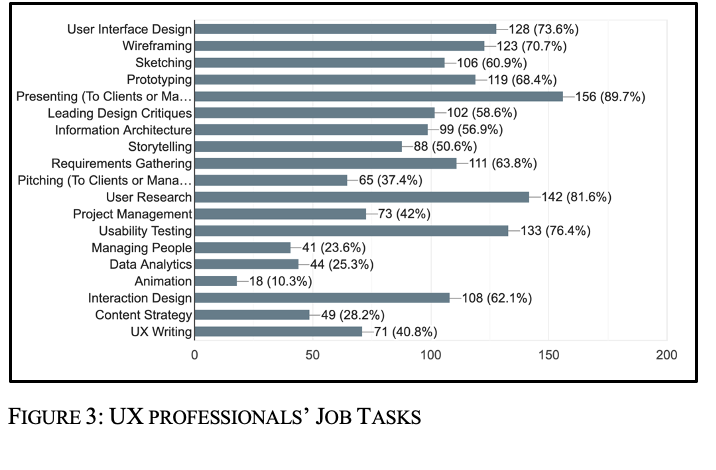
Job Tasks
The UX professionals in this study performed a diverse range of tasks. Each respondent reported performing at least three of the 19 different tasks listed on the survey. More commonly, the UX professionals reported being responsible for 5 or more tasks.
Most of the UX Designers and Senior UX Designers reported that their jobs involved every task shown in Figure 3. In contrast, most of the Senior Product Designers did not perform animation or UX writing tasks; those tasks were more frequently performed by UX Researchers. Figure 3 shows the frequency of other tasks performed.
Hours Worked
The majority of the survey respondents work full time (86.5%). In this study, we’ve defined full time as working 36 or more hours per week. The respondents typically work 40–45 hours per week. Only 23 of the respondents work part time (13.5%).
Teamwork
Most of the survey respondents (85.6%) work as part of a UX team. The composition of teams skewed slightly in favor of men. Of the 133 respondents who work on UX teams, 31 reported equal numbers of males and females on the teams; 50 reported a higher number of females on the teams, and 52 reported a higher number of males on the teams. The number of nonbinary team members were not analyzed because the data were not reliable.
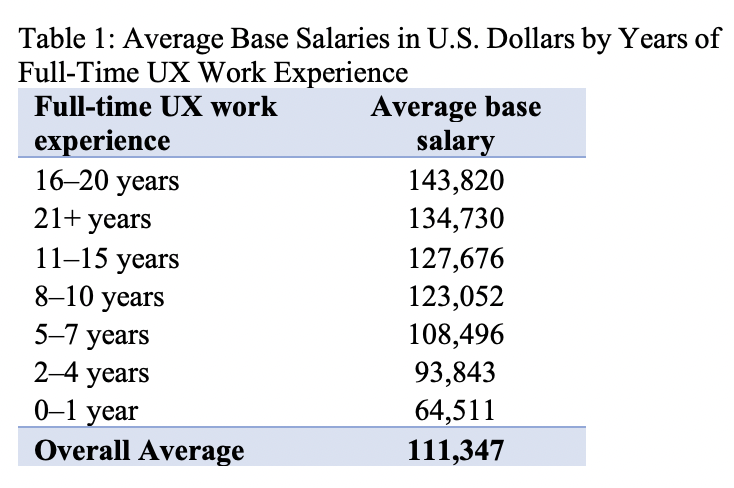
Trend: Base Salary by UX Work Experience
As one would expect, base salaries generally increase with years of experience. In this data set, that prediction does not hold true for UX professionals with 21 or more years of UX work experience (see Table 1). It is unclear whether these lower-than-expected base salaries are anomalies or whether bonuses offset those salary differences.
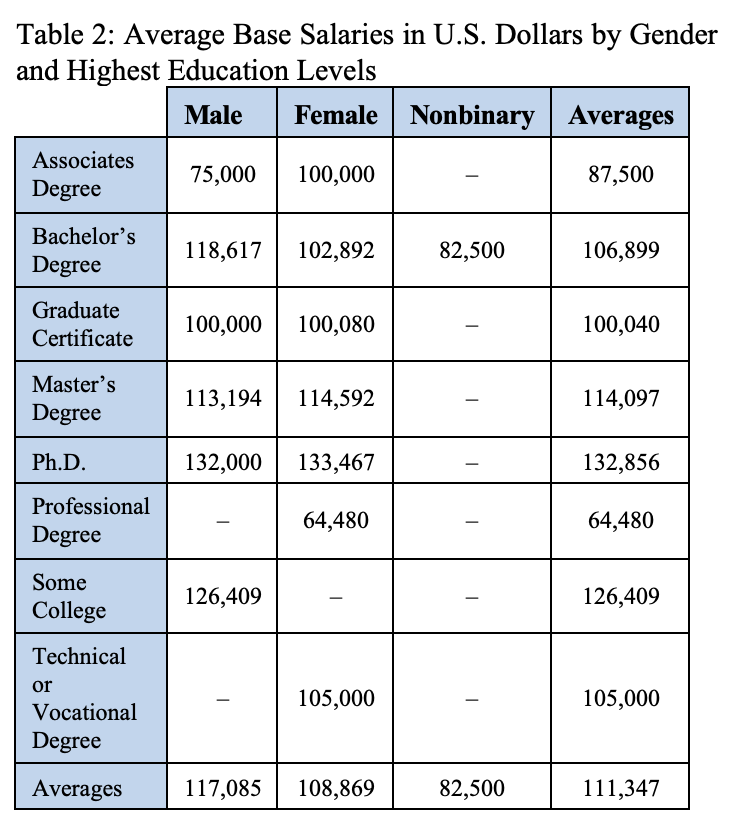
Trend: Base Salary by Gender and Education Level
Table 2 shows the potential effects of education and gender on base salary levels. In some cases, the data are insufficient to make inferences. For example, only two respondents reported associate degrees as their highest education level: one male and one female. While only two UX professionals in this study identified as nonbinary, notable difference in salaries for those with bachelor’s degrees indicate further investigation is needed.
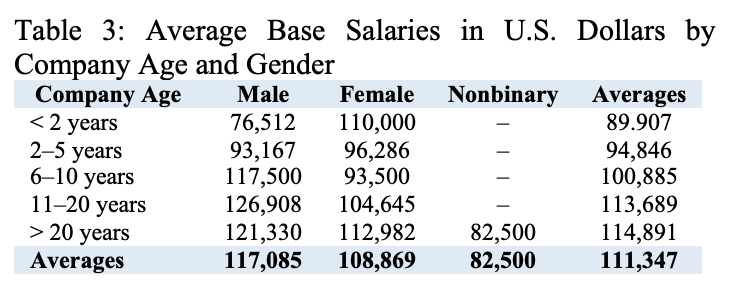
Trend: Base Salary by Gender and Company Age
Table 3 compares base salaries for each gender working at companies of different ages. Again, we must be cautious when interpreting the data due to sample sizes and other factors that may not be obvious. For instance, only 5 people worked at companies less than two years old.
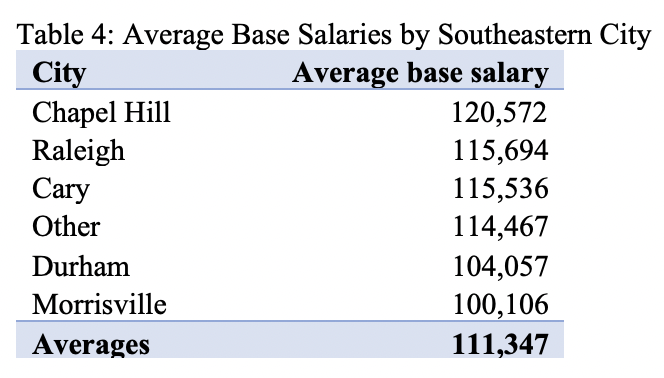
Trend: Base Salary by City
Table 4 presents the average base salaries for each city in the area studied. While the $20,466 range between highest and lowest salaries may seem minimal, the cost of living and cost of housing varies considerably between these cities. For example, housing costs the least in Durham and the most in Chapel Hill. Overall, Cary is the most expensive place to live [31]. UX professionals who commute from less expensive locations will need to factor those added transportation costs into their evaluation of the net value of potential salaries.
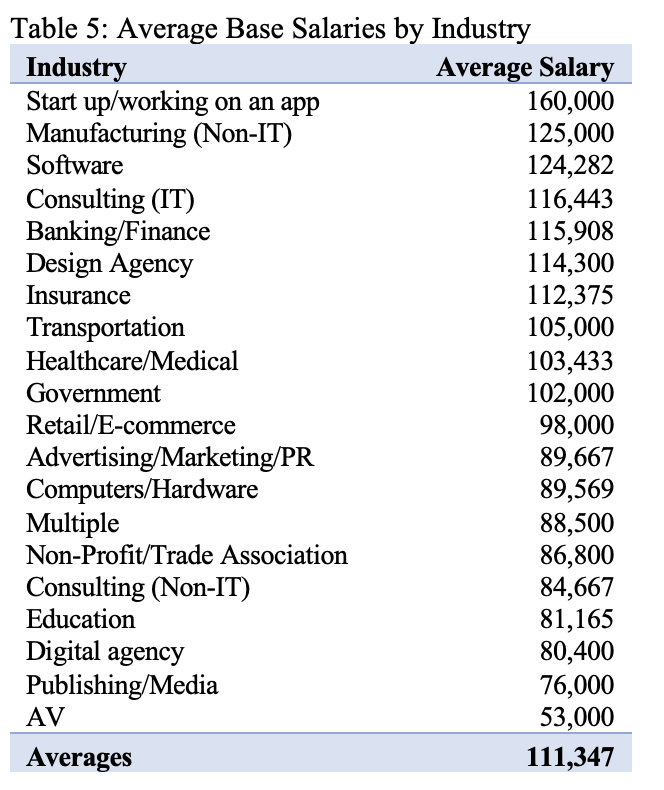
Trend: Base Salary by Industry
UX work appears to be more lucrative in some industries than others. At face value, the data in Table 5 suggest that start-ups offer the best opportunities in terms of base salary; however, only one survey respondent reported working for a start-up. At the other end of the salary spectrum is AV, and again, that figure represents a single worker.
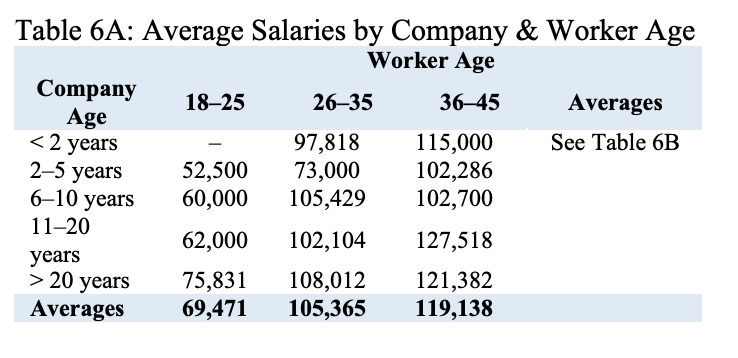
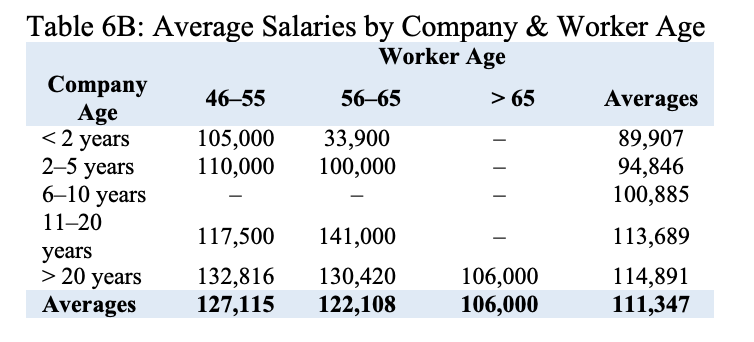
Trend: Base Salary by Age and Company Age
Tables 6A and 6B show average base salaries by worker age and by company age. This data includes part-time and full-time workers salaries. The lowest figure represents one part-time worker. The intersection between company age and worker age appears to have little impact on salaries across all groups.
Trend: Base Salary, Gender, Company Age, and UX Teamwork
Finally, our analysis revealed a few notable findings for UX professionals working on teams in specific situations:
-
Those working on teams at companies less than 2 years old and between 2 and 5 years old earned significantly higher salaries.
-
Those who performed UX work at companies that were 11 or more years old worked on teams that included two to three times more women.
-
Those who worked for companies with 2,501 to 10,000 employees worked on teams that included twice as many men as those working in companies with 1,001 to 2,500 employees.
-
Those who worked on UX teams typically earned more than those who did not work on teams.
Trend: Breadth of Knowledge
UX professionals are expected to perform a wide variety of tasks. Most of our respondents reported leveraging a wide variety of UX-related skillsets, ranging from user interface design (73.6%) to user research (81.6%). Sizable minorities of participants also engaged in less common skillsets such as UX writing (40.8%). This could indicate that UX professionals are incredibly diverse professionals who use a wide variety of skills in their work lives and don’t particularly specialize.
Conclusions: A Skills-Diverse, Well-Paid Field
It’s clear that UX, at least in the Triangle Area, is a profession that requires a lot of diverse skill sets, but that is also well-compensated. And as people gain more experience and education, their wages also seem to go up. These are the types of trends we want to see in any healthy, professional field.
One open question that we are pondering on the academic side of things in light of these findings is: how can academics help train new UX professionals when they rely on so many skill sets? One answer: partnering with members of industry. If you are a UX professional and would like to be involved in educational initiatives, please feel free to email me at gettog@ecu.edu.
Regardless, we hope this blog is useful in your UX career!